CURRENT AFFAIRS | 30 JUNE 2026
India’s Index of Industrial Production (IIP) rose 5.1% year-on-year in May 2026 — a five-month high — up from 4.9% in April, according to data released by the Ministry of Statistics and Programme Implementation (MoSPI). The uptick was broad-based, with manufacturing output growing 5.5% and electricity generation surging 11.1%, driven in large part by an early heat wave that pushed power demand to seasonal peaks. Renewable electricity generation led the charge with an 18% jump, while non-renewable electricity grew 8.8%.
The May 2026 release also carries a structural significance: it is among the first releases under the new IIP series with a revised base year of 2022-23, replacing the earlier 2011-12 base year series. The revision updates the basket of goods tracked, reflects the current composition of India’s industrial economy, and recalibrates weights for sectors such as electronics, electric vehicles, and renewable energy — categories that have grown massively since 2011.
The IIP is a statistical instrument, not a legislative one — but it sits within a well-defined institutional and regulatory architecture that CLAT passages frequently reference.
MoSPI (Ministry of Statistics and Programme Implementation) is the nodal ministry responsible for the official statistical system of India. Within MoSPI, the National Statistical Office (NSO) compiles and releases the IIP on a monthly basis, with a six-week lag (May data released in late June). MoSPI’s mandate flows from the government’s obligation under Article 246 read with Entry 45 of the Union List (Survey of India) and broader Union government functions related to national data collection.
The Eight Core Industries (ICI) — coal, crude oil, natural gas, refinery products, fertilisers, steel, cement, and electricity — have a combined weight of 40.27% in the IIP basket. Their index is released ahead of the IIP, functioning as a leading indicator. The core industries report is produced by the Ministry of Commerce and Industry.
The base year revision from 2011-12 to 2022-23 is significant in law and policy terms: it reflects the recommendations of successive statistical commissions and brings India in line with international best practice (the UN recommends base year updates every five years). Statistical methodology falls squarely within the domain of the Union government under Entry 45 of the Union List, and the National Statistical Commission (NSC) — a statutory body under the Statistics Collection Act, 2008 — provides oversight.
Among the use-based classification categories, capital goods output — a proxy for investment activity in the economy — is closely watched by analysts and policymakers. A sustained uptick in capital goods signals that businesses are investing in new machinery and capacity, which is a forward-looking indicator for future growth. In May 2026, standout performers within manufacturing included electrical equipment (+20.8%), motor vehicles (+14.5%), and fabricated metal products (+15%), suggesting that both consumer demand and industrial investment remained robust.
Economy-based reading comprehension passages in CLAT often involve indices, growth rates, and institutional mandates — all of which appear in this IIP story. Here is what a CLAT student must command:
What the IIP measures: Industrial output across three broad sectors — mining, manufacturing, and electricity. Manufacturing has the dominant weight (~77%). IIP is a volume index, measuring quantum of production, not value.
Classification systems:
- Sectoral: Mining | Manufacturing | Electricity
- Use-based: Primary goods | Capital goods | Intermediate goods | Infrastructure/Construction goods | Consumer durables | Consumer non-durables
Why base year matters: A stale base year over-weights declining industries and under-weights growing ones, distorting the picture. The shift from 2011-12 to 2022-23 means the IIP now better reflects India’s industrial structure in the post-COVID, EV-and-renewables era.
IIP as a lead indicator: IIP is released with a ~6-week lag but is one of the first hard data points on economic activity each month, before GDP figures. CLAT passages may ask students to distinguish between leading, lagging, and coincident indicators — IIP is primarily a coincident indicator (measures current output) with some leading properties in capital goods sub-components.
Passage inference question type: “If renewable electricity generation grew 18% while overall electricity grew 11.1%, what can be inferred about non-renewable electricity’s share?” This requires proportional reasoning — exactly the kind of applied inference CLAT tests.
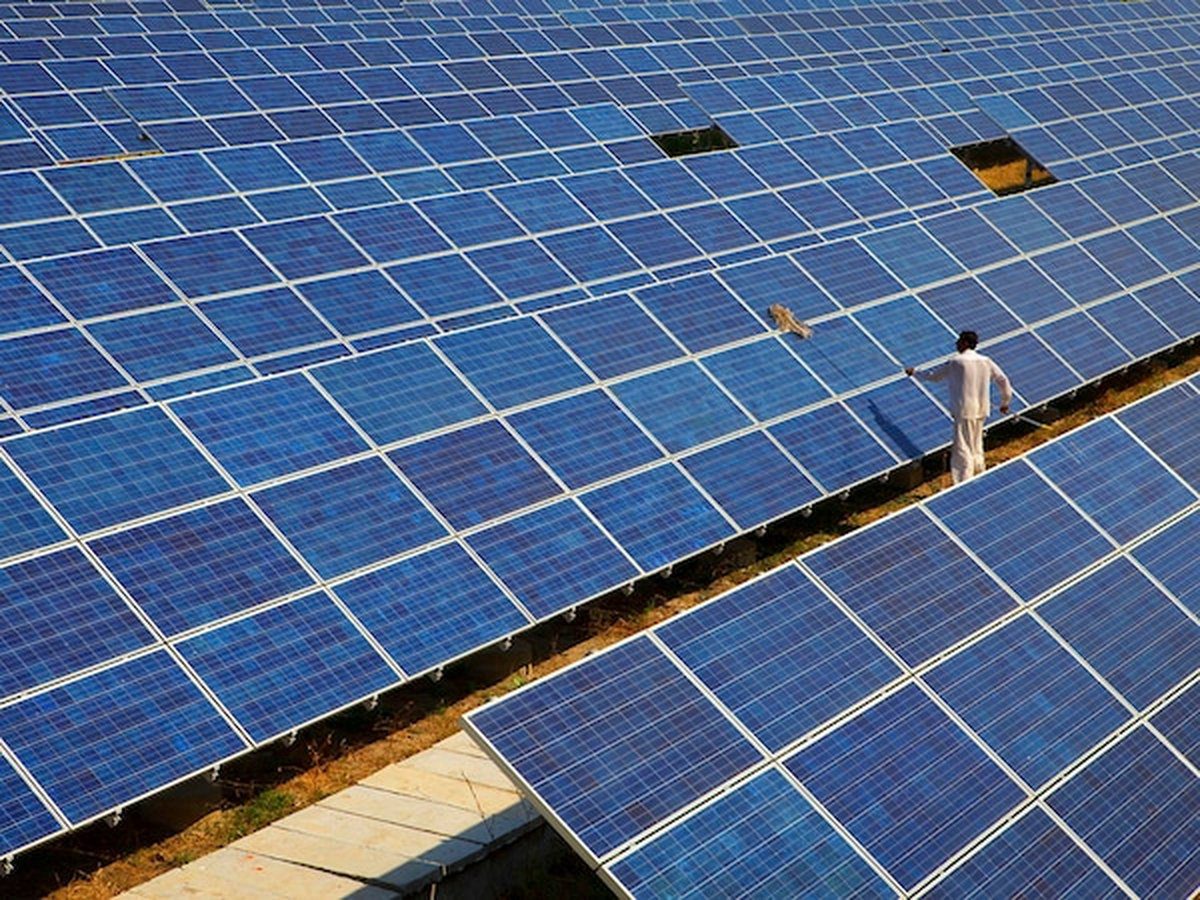
The electricity surge in May 2026 is particularly instructive. Peak summer demand — driven by air conditioners, industrial cooling, and irrigation pumps — typically stresses the grid in April–June. The 18% jump in renewable electricity output reflects both the expanding installed capacity of solar and wind energy and favourable seasonal conditions (higher solar irradiance, pre-monsoon winds). This renewables data point intersects with India’s commitments under the Paris Agreement and its 500 GW non-fossil capacity target for 2030 — another CLAT-relevant international law hook.
| Parameter | Detail |
|---|---|
| IIP growth, May 2026 | 5.1% (YoY) — 5-month high |
| IIP growth, April 2026 | 4.9% (YoY) |
| Manufacturing growth | 5.5% — 16 of 23 industry groups in positive territory |
| Overall electricity growth | 11.1% |
| Renewable electricity | +18% |
| Non-renewable electricity | +8.8% |
| Top manufacturing sub-sectors | Electrical equipment (+20.8%), Motor vehicles (+14.5%), Fabricated metals (+15%) |
| Releasing authority | MoSPI / National Statistical Office (NSO) |
| Current base year | 2022-23 (new series; earlier series used 2011-12) |
| IIP sectoral split | Mining | Manufacturing (~77% weight) | Electricity |
| Eight Core Industries weight in IIP | ~40.27% of IIP basket |
| Core industries released by | Ministry of Commerce and Industry |
For CLAT 2027 aspirants, the IIP story is not merely about a single data point. It connects macroeconomic monitoring (why governments track industrial output) to institutional design (MoSPI’s role), to international commitments (India’s renewable energy targets), and to inference skills (reading percentage data accurately). A well-prepared student will be able to situate the 5.1% figure within India’s broader growth narrative — and answer a passage question that asks whether an 11.1% electricity growth rate is consistent with an 18% renewable and 8.8% non-renewable split — without a calculator.
“MoSPI’s MAY MINE” — MoSPI releases IIP; sectors are Manufacturing, Mining, Electricity (MME). Manufacturing is the largest (~77%).
For the base year: “Old base = 2011; New base = 2022” — just remember 11 years apart, and the new one started being used in 2026.
Eight Core Industries shortcut — CCNRFSCE: Coal, Crude oil, Natural gas, Refinery products, Fertilisers, Steel, Cement, Electricity. Weight = ~40% of IIP.
May 2026 numbers: 5-1-1-1-8 → 5.1% IIP, 11.1% electricity, 18% renewables. Read it as a phone number fragment: 5-1-1-1-8.
Use-based categories: PCICC — Primary, Capital, Intermediate, Consumer durables, Consumer non-durables. Capital goods = investment barometer; consumer non-durables = FMCG health.
Test Yourself — Quick Quiz
Practice Quiz — 10 CLAT-Style Questions
Click an option to reveal the answer and explanation.